
Wednesday, August 30, 2017
USDJPY analysis for 30.08.2017
Japan is releasing Retail Sales y/y data and the US will publish Crude Oil Inventories, Prelim GDP Price Index q/q, Prelim GDP q/q and ADP Non-Farm Employment Change.
The support rests at 109.660 with resistance at 110.040 which both lines are above the weekly pivot point at 109.260. The EMA of 10 is moving with bullish bias along the ascendant channel but it is below the EMA of 100 and the EMA of 200. The RSI is rising towards the overbought area, the Stochastic is showing upward momentum and the MACD indicator is in neutral territory. The ADX is showing buy signals.
Long positions are recommended towards 110.50.
https://fxglory.com/usdjpy-analysis-for-30-08-2017/

NZDUSD analysis for 30.08.2017
There are no major economic reports in New Zealand however the US is publishing GDP Growth Rate QoQ 2nd Est, ADP Employment Change and Fed Powell Speech.
The support rests at 0.72090 with resistance at 0.72830 which the weekly pivot point at 0.72560 is located in between the lines. The EMA of 10 is moving with bullish bias along the ascendant channel but it is below the EMA of 100 and 200. The RSI is moving on the 50 level, the MACD indicator is in neutral territory and the Stochastic is showing downward momentum. The ADX is not showing any clear signals. The price is in the Ichimoku Cloud and below the Chinkou Span. The Tenkan-sen and the Kijun-sen are both showing a horizontal trend.
Regardless of the downward momentum, NZDUSD will continue its bullish trend towards 0.733.
https://fxglory.com/nzdusd-analysis-for-30-08-2017/


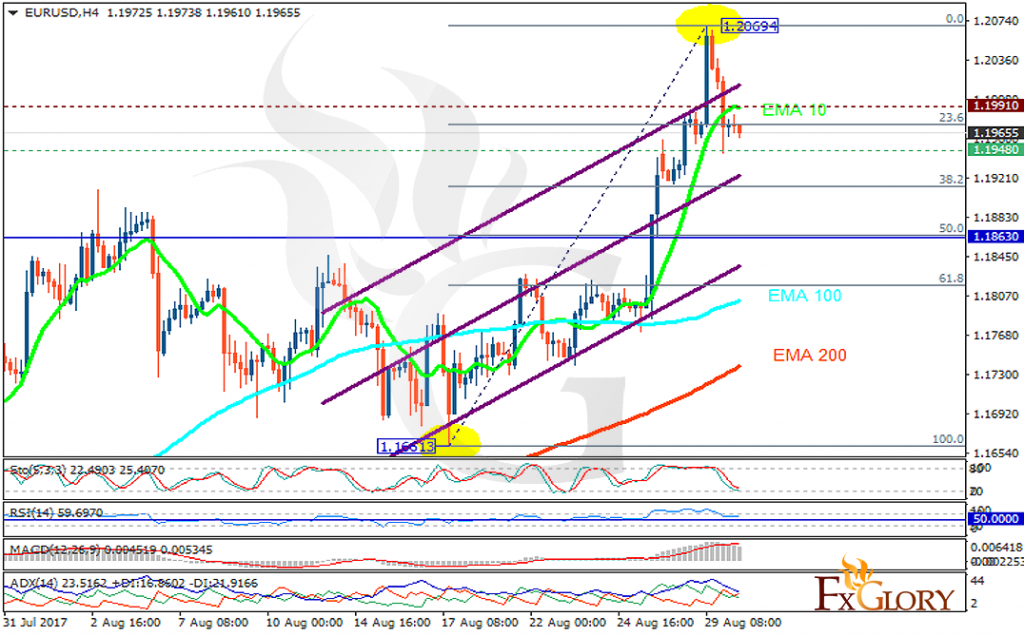
EURUSD analysis for 30.08.2017
EURUSD grew high as a result of Draghi and Yellen’s speeches and today this pair is chiefly under the influence of the Preliminary GDP data and the ADP data from the US.
The support rests at 1.19480 with resistance at 1.19910 which both lines are above the weekly pivot point at 1.18630. The EMA of 10 is moving with bullish bias along the ascendant channel and it is above the EMA of 100 and the EMA of 200. The RSI is moving below the overbought area, the Stochastic is moving in low ranges and the MACD indicator is in positive territory. The ADX is showing sell signals.
It seems that the correction pattern has just started towards 61.8 level of Fibonacci, otherwise, EURUSD will continue its bullish trend towards 1.25 area.
https://fxglory.com/eurusd-analysis-for-30-08-2017/

Tuesday, August 29, 2017
Gold analysis for 29.08.2017
Gold is growing up as a result of US dollar and stock markets being under pressure.
The support rests at 1309.73 with resistance at 1327.71 which both lines are above the weekly pivot point at 1293.53. The EMA of 10 is moving with bullish bias along the ascendant channel and it is above the EMA of 200 and the EMA of 100. The RSI is moving in overbought area, the Stochastic is moving in high ranges and the MACD indicator is in positive territory. The ADX is showing buy signals. The price is above the Ichimoku Cloud and below the Chinkou Span. The Tenkan-sen and the Kijun-sen are both showing an upward trend.
Gold will continue its bullish trend towards 1333.
https://fxglory.com/gold-analysis-for-29-08-2017/


GBPUSD analysis for 29.08.2017
GBPUSD will be volatile today because, due to the UK holiday yesterday, GBP did not have a chance to react to Yellen’s speech.
The support rests at 1.29110 with resistance at 1.29540 which both lines are above the weekly pivot point at 1.28550. The EMA of 10 is moving with bullish bias along the ascendant channel but it is below the EMA of 200 and the EMA of 100. The RSI is moving in overbought area, the Stochastic is showing upward momentum and the MACD indicator is in positive territory. The ADX is showing buy signals.
Long positions are recommended targeting 1.30.
https://fxglory.com/gbpusd-analysis-for-29-08-2017/


EURUSD analysis for 29.08.2017
As EUR is getting stronger due to the economic reports, USD is under pressure. Today French Prelim GDP q/q, French Consumer Spending m/m, and German GfK Consumer Climate will be released in Eurozone along with the CB Consumer Confidence and S&P/CS Composite-20 HPI y/y in the US.
The support rests at 1.19380 with resistance at 1.19980 which both lines are above the weekly pivot point at 1.18630. The EMA of 10 is moving with bullish bias along the ascendant channel and it is above the EMA of 200 and the EMA of 100. The RSI is moving in overbought area, the Stochastic is showing upward momentum and the MACD indicator is in positive territory. The ADX is showing buy signals.
EURUSD will continue its upward trend towards 1.2 area including pullbacks on the way.
https://fxglory.com/eurusd-analysis-for-29-08-2017/

Wednesday, August 23, 2017
USDCAD analysis for 23.08.2017
USDCAD is moving with bearish bias creating lower highs and lower lows.
The pair is finding support at 1.25610 with resistance at 1.26110 which both lines are below the weekly pivot point at 1.26380. The EMA of 10 is moving with bearish bias along the descendant channel and it is located below the EMA of 200 and the EMA of 100. The RSI is moving horizontally on the 50 level, the MACD indicator is in negative territory and the Stochastic is showing upward momentum. The ADX is showing buy signals. The price is below the Ichimoku Cloud and above the Chinkou Span. The Tenkan-sen is showing a downward trend while the Kijun-sen is showing a horizontal trend.
Despite the pair’s attempt to go up, the resistance area seems to be too strong to be broken, therefore, short positions are recommended towards 1.2500.
https://fxglory.com/11389/


GBPUSD analysis for 23.08.2017
GBP is under pressure due to Brexit issue.
The support rests at 1.27970 with resistance at 1.28350 which both lines are below the weekly pivot point at 1.29080. The EMA of 10 is moving with bearish bias along the descendant channel and it is below the EMA of 200 and the EMA of 100. The RSI is moving in the oversold area, the Stochastic is showing downward momentum and MACD indicator is in negative territory. The ADX is showing sell signals.
Short positions are recommended targeting 1.2750.
https://fxglory.com/gbpusd-analysis-for-23-08-2017/


EURUSD analysis for 23.08.2017
There are no major economic reports in the US or Eurozone and traders are waiting for Draghi’s speech.
The support rests at 1.17380 with resistance at 1.17760 which the weekly pivot point at 1.17520 is located in between the lines. The EMA of 10 is moving with bearish bias along the descendant channel and it is below the EMA of 100 and above the EMA of 200. The RSI is moving on the 50 level, the Stochastic is showing downward momentum and the MACD indicator is in neutral territory. The ADX is showing weak sell signals.
Due to lack of economic reports for EURUSD, this pair will be consolidating within the support and resistance area, today.
https://fxglory.com/eurusd-analysis-for-23-08-2017/


Tuesday, August 22, 2017
USDJPY analysis for 22.08.2017
Japan is not releasing any important economic reports however, the US is publishing Richmond Manufacturing Index and HPI m/m.
The support rests at 109.100 with resistance at 109.550 which both lines are below the monthly pivot point at 111.650. The EMA of 10 is moving with bearish bias along the descendant channel and it is below the EMA of 100 and the EMA of 200. The RSI is rising towards the 50 level, the Stochastic is showing upward momentum and the MACD indicator is in negative territory. The ADX is showing buy signals.
USDJPY is growing towards 110 area; however, in case of price decline, sellers can target 108.5.
https://fxglory.com/usdjpy-analysis-for-22-08-2017/


USDCHF analysis for 22.08.2017
Switzerland has published Balance of Trade and the US is releasing House Price Index MoM.
The support rests at 0.96140 with resistance at 0.96570 which both lines are below the weekly pivot point at 0.96660. The EMA of 10 is moving with bullish bias along the ascendant channel and it is located above the EMA of 200 and below the EMA of 100. The RSI is rising towards the 50 level, the MACD indicator is in negative territory and the Stochastic is showing upward momentum. The ADX is showing weak buy signals. The price is below the Ichimoku Cloud and above the Chinkou Span. The Tenkan-sen is showing an upward trend while the Kijun-sen is showing a horizontal trend.
Long positions are recommended towards 0.968.
https://fxglory.com/usdchf-analysis-for-22-08-2017/


EURUSD analysis for 22.08.2017
Traders are waiting for Draghi’s speech this week and today German ZEW Economic Sentiment may support EUR against USD.
The support rests at 1.17750 with resistance at 1.18190 which both lines are above the weekly pivot point at 1.17520. The EMA of 10 is moving with bullish bias along the ascendant channel and it has reached the EMA of 100; besides, they are both above the EMA of 200. The RSI is falling down towards the 50 level, the Stochastic is showing downward momentum and the MACD indicator is in positive territory. The ADX is not showing any clear signals.
Long positions are recommended targeting 1.185; however, the support level breakthrough can bring sellers back to the market to target 1.173.
https://fxglory.com/eurusd-analysis-for-22-08-2017/


Monday, August 21, 2017
NZDUSD analysis for 21.08.2017
NZD has been supported by some economic reports such as Quarterly Retail Sales and Core Retail Sales.
The support rests in 0.73040 with resistance at 0.73280 which both lines are above the weekly pivot point at 0.72890. The EMA of 10 is moving with bullish bias along the ascendant channel but it is below the EMA of 200 and the EMA of 100. The RSI is moving horizontally on the 50 level, the MACD indicator is in neutral territory and the Stochastic is showing downward momentum. The ADX is not showing any clear signals. The price is in the Ichimoku Cloud and below the Chinkou Span. The Tenkan-sen and the Kijun-sen are both showing a horizontal trend.
The resistance level breakout will smooth the way for further growth towards 0.7350, otherwise pair will drop to 0.729.
https://fxglory.com/nzdusd-analysis-for-21-08-2017/


GBPUSD analysis for 21.08.2017
It seems that BOE is not supporting GBP when it comes to the rate hike and GBP is under pressure due to the Brexit issue.
The support rests at 1.28570 with resistance at 1.28890 which both lines are below the weekly pivot point at 1.29080. The EMA of 10 is moving with bearish bias along the descendant channel and it is below the EMA of 200 and the EMA of 100. The RSI is moving horizontally on the 50 level, the Stochastic is showing upward momentum and the MACD indicator is in negative territory. The ADX is not showing any clear signals.
Short positions are recommended towards 1.2800.
https://fxglory.com/gbpusd-analysis-for-21-08-2017/


EURUSD analysis for 21.08.2017
There are no major economic reports for EURUSD today.
The support rests at 1.17360 with resistance at 1.17690 which the weekly pivot point at 1.17520 is located in between the lines. The EMA of 10 is moving with bullish bias and it is above the EMA of 200 and the EMA of 100. The RSI is moving on the 50 level, the Stochastic is showing downward momentum and the MACD indicator is in neutral territory. The ADX is showing weak buy signals.
Since the market is quiet today, EURUSD will be fluctuating within the support and resistance area. However, the support level breakthrough can drag the pair towards 1.165.
https://fxglory.com/eurusd-analysis-for-21-08-2017/


Friday, August 18, 2017
USDJPY analysis for 18.08.2017
Japan is not releasing any economic reports but the US is publishing Prelim UoM Inflation Expectations and Prelim UoM Consumer Sentiment.
The support rests at 109.100 with resistance at 109.460 which both lines are below the weekly pivot point at 109.600. The EMA of 10 is moving with bearish bias along the descendant channel and it is below the EMA of 100 and the EMA of 200. The RSI is falling towards the oversold area, the Stochastic is showing downward momentum and the MACD indicator is in neutral territory. The ADX is showing sell signals.
USDJPY will continue its bearish trend towards 108.5.
https://fxglory.com/usdjpy-analysis-for-18-08-2017/


USDCAD analysis for 18.08.2017
The Oil prices are supporting CAD against its American counterpart.
The pair is finding support at 1.26430 with resistance at 1.26810 which both lines are above the monthly pivot point at 1.26350. The EMA of 10 is moving with bearish bias along the descendant channel and it is located below the EMA of 200 and above the EMA of 100. The RSI is moving horizontally on the 50 level, the MACD indicator is in negative territory and the Stochastic is showing downward momentum. The ADX is not showing any clear signals. The price is in the Ichimoku Cloud and above the Chinkou Span. The Tenkan-sen is showing a downward trend while the Kijun-sen is showing a horizontal trend.
Despite the price attempt to break the resistance area, it will fall down towards 1.25.
https://fxglory.com/usdcad-analysis-for-18-08-2017/


EURUSD analysis for 18.08.2017
Yesterday USD was supported by a dovish FOMC meeting minutes; however, it fell again due to the terrorist attack in Spain.
The support rests at 1.17170 with resistance at 1.17490 which both lines are below the weekly pivot point at 1.17850. The EMA of 10 is moving with bullish bias along the ascendant channel but it is below the EMA of 100 and above the EMA of 200. The RSI is moving horizontally on the 50 level, the Stochastic is showing upward momentum and the MACD indicator is in negative territory. The ADX is not showing any clear signals.
Long positions are recommended towards 1.18 area.
https://fxglory.com/eurusd-analysis-for-18-08-2017/


Thursday, August 17, 2017
GBPUSD analysis for 17.08.2017
GBP has been supported by the average earnings index data and today the retail sales data will be release for the UK.
The support rests at 1.28750 with resistance at 1.29230 which both lines are below the weekly pivot point at 1.30010. The EMA of 10 is moving with bearish bias along the descendant channel and it is below the EMA of 200 and the EMA of 100. The RSI is moving horizontally below the 50 level, the Stochastic is showing upward momentum and the MACD indicator is in negative territory. The ADX is showing buy signals.
The support level breakthrough will smooth the way for further decline towards 1.280; otherwise, GBPUSD will grow towards 1.30.
https://fxglory.com/gbpusd-analysis-for-17-08-2017/


EURUSD analysis for 17.08.2017
The housing starts report put pressure on USD and today CPI data and the monetary policy meeting is being released in Eurozone.
The support rests at 1.17540 with resistance at 1.18020 which the weekly pivot point at 1.17850 is located in between the lines. The EMA of 10 is moving with bullish bias along the ascendant channel and it is above the EMA of 200 and the EMA of 100. The RSI is moving above the 50 level, the Stochastic is showing upward momentum and the MACD indicator is in negative territory. The ADX is showing buy signals.
Long positions are recommended towards 1.185.
https://fxglory.com/eurusd-analysis-for-17-08-2017/


AUDUSD analysis for 17.08.2017
AUDUSD will be volatile today due to some economic reports such as Unemployment Rate and Change in Australia and Initial Jobless Claims in the US.
The support rests in 0.79030 with resistance at 0.79650 which both lines are above the weekly pivot point at 0.78920. The EMA of 10 is moving with bullish bias along the ascendant channel and it is located above the EMA of 100 and the EMA of 200. The RSI is moving in overbought area, the MACD indicator is in positive territory and the Stochastic is showing downward momentum. The ADX is showing buy signals. The price is above the Ichimoku Cloud and the Chinkou Span. The Tenkan-sen and the Kijun-sen are both showing a horizontal trend.
While all indicators are showing an upward trend, the resistance area seems to be too strong to be broken; therefore, as the price may rise towards the resistance area, sellers can target 0.78770.
https://fxglory.com/audusd-analysis-for-17-08-2017/


Wednesday, August 16, 2017
USDJPY analysis for 16.08.2017
While Japan is not releasing any economic data today, the US is publishing FOMC Meeting Minutes, Crude Oil Inventories, Housing Starts and Building Permits.
The support rests at 110.540 with resistance at 110.840 which both lines are above the weekly pivot point at 109.600. The EMA of 10 is moving with bullish bias along the ascendant channel but it is below the EMA of 100 and the EMA of 200. The RSI is moving in overbought area, the Stochastic is showing upward momentum and the MACD indicator is in positive territory. The ADX is showing buy signals.
Long positions are recommended targeting 111.
https://fxglory.com/usdjpy-analysis-for-16-08-2017/


USDCHF analysis for 16.08.2017
USDCHF is chiefly under the influence of the US economic reports such as FOMC Meeting Minutes and Building Permits.
The support rests at 0.97160 with resistance at 0.97400 which both lines are above the weekly pivot point at 0.96560. The EMA of 10 is moving with bullish bias along the ascendant channel and it is located above the EMA of 200 and the EMA of 100. The RSI is moving horizontally above the 50 level, the MACD indicator is in positive territory and the Stochastic is moving in middle ranges. The ADX is showing buy signals. The price is above the Ichimoku Cloud and the Chinkou Span. The Tenkan-sen is showing an upward trend while the Kijun-sen is showing a horizontal trend.
The resistance level breakout will ease the way for further growth towards 0.9800; otherwise, it will drop to 0.96710.
https://fxglory.com/usdchf-analysis-for-16-08-2017/


EURUSD analysis for 16.08.2017
The strong retail sales data from the US supported USD.
The support rests at 1.17290 with resistance at 1.17490 which both lines are below the weekly pivot point at 1.17850. The EMA of 10 is moving with bearish bias along the descendant channel but it is above the EMA of 200 and the EMA of 100. The RSI is moving below the 50 level, the Stochastic is showing upward momentum and the MACD indicator is in negative territory. The ADX is showing buy signals.
EURUSD will continue its bearish trend towards 1.1650.
https://fxglory.com/eurusd-analysis-for-16-08-2017/


Gold analysis for 15.08.2017
Gold is chiefly under the influence of the US and North Korea issue, besides, New York Fed President William Dudley’s speech put pressure on Gold.
The support rests at 1269.82 with resistance at 1286.34 which the weekly pivot point at 1260.53 is located in between the lines. The EMA of 10 is moving with bearish bias but it is above the EMA of 200 and the EMA of 100. The RSI is rising towards the 50 level, the Stochastic is moving in low ranges and the MACD indicator is in positive territory. The ADX is not showing any clear signals. The price is in the Ichimoku Cloud and above the Chinkou Span. The Tenkan-sen is showing downward trend while the Kijun-sen is showing an upward trend.
The support area seems to be too strong to be broken therefore Gold will grow to 1300 area; however, in case of the price decline, sellers can target 1250.
https://fxglory.com/gold-analysis-for-15-08-2017/


GBPUSD analysis for 15.08.2017
The UK is releasing the inflation data in the form of CPI which will cause a volatile market for GBPUSD. The US is also publishing Retail sales data.
The support rests at 1.29330 with resistance at 1.29690 which both lines are below the weekly pivot point at 1.30010. The EMA of 10 is moving with bearish bias along the descendant channel and it is below the EMA of 200 and the EMA of 100. The RSI is falling towards the oversold area, the Stochastic is showing downward momentum and MACD indicator is in negative territory. The ADX is showing sell signals.
Short positions are recommended targeting 1.29.
https://fxglory.com/gbpusd-analysis-for-15-08-2017/


EURUSD analysis for 15.08.2017
USD has been under pressure due to the US poor economic data, moreover, yesterday there was no economic reports to empower this currency. Today the US is publishing the retail sales data which might support USD.
The support rests at 1.17470 with resistance at 1.17980 which the weekly pivot point at 1.17850 is located in between the lines. The EMA of 10 is moving with bearish bias along the descendant channel but it is above the EMA of 200 and the EMA of 100. The RSI is falling towards the oversold area, the Stochastic is showing downward momentum and the MACD indicator is in neutral territory. The ADX is showing sell signals.
The support level breakthrough will drag the price down to 1.15 otherwise it will grow to 1.18.
https://fxglory.com/eurusd-analysis-for-15-08-2017/


Monday, August 14, 2017
USDJPY analysis for 14.08.2017
The Japan is releasing The preliminary GDP price index y/y and the preliminary estimate of the GDP while the US is not publishing any economic data.
The support rests at 109.360 with resistance at 109.960 which the weekly pivot point at 109.600 is located in between the lines. The EMA of 10 is moving with bearish bias and it is below the EMA of 100 and the EMA of 200. The RSI is moving horizontally on the 50 level, the Stochastic is showing upward momentum and the MACD indicator is in negative territory. The ADX is showing buy signals.
It seems that bulls are taking the control over the chart towards 111 area.
https://fxglory.com/usdjpy-analysis-for-14-08-2017/


EURUSD analysis for 14.08.2017
Today we are not having a volatile market for EURUSD since there are no major economic reports in Eurozone or the US.
The support rests at 1.17930 with resistance at 1.18470 which both lines are above the weekly pivot point at 1.17850. The EMA of 10 is moving with bullish bias along the ascendant channel and it is above the EMA of 200 and the EMA of 100. The RSI is falling towards the 50 level, the Stochastic is showing downwards momentum and the MACD indicator is in neutral territory. The ADX is not showing any clear signals.
Short positions are recommended targeting 1.1689.
https://fxglory.com/eurusd-analysis-for-14-08-2017/


Friday, August 11, 2017
GBPUSD analysis for 11.08.2017
GBP has been supported by the UK strong manufacturing production data but it is not enough to create the correction pattern.
The support rests at 1.29610 with resistance at 1.30130 which both lines are below the weekly pivot point at 1.31080. The EMA of 10 is moving with bearish bias along the descendant channel and it is below the EMA of 200 and the EMA of 100. The RSI is falling towards the oversold area, the Stochastic is showing downward momentum and MACD indicator is in negative territory. The ADX is not showing any clear signals.
Short positions are recommended targeting 1.2897.
https://fxglory.com/gbpusd-analysis-for-11-08-2017/


EURUSD analysis for 11.08.2017
The threatening speeches between the US and North Korea is leaving enormous impact on pairs, commodities and stocks. As USD is again under pressure, traders are looking ahead for the US CPI data.
The support rests at 1.17500 with resistance at 1.17850 which both lines are below the weekly pivot point at 1.18010. The EMA of 10 is moving with bullish bias along the ascendant channel and it is above the EMA of 200 and the EMA of 100. The RSI is rising towards the 50 level, the Stochastic is moving in high ranges and the MACD indicator is in negative territory. The ADX is not showing any clear signals.
EURUSD will continue its long term bullish bias towards 1.1820 creating an opportunity for sellers to target 1.16.
https://fxglory.com/eurusd-analysis-for-11-08-2017/


AUDUSD analysis for 11.08.2017
AUD is under pressure due to the US and North Korea issue. The US is publishing some economic reports such as Core Inflation Rate YoY and Inflation Rate YoY.
The support rests at 0.78190 with resistance at 0.78890 which both lines are below the weekly pivot point at 0.79540. The EMA of 10 is moving with bearish bias along the descendant channel and it is above the EMA of 200 and below the EMA of 100. The RSI is moving in oversold area, the MACD indicator is in negative territory and the Stochastic is moving in low ranges. The ADX is showing weak sell signals. The price is below the Ichimoku Cloud and above the Chinkou Span. The Tenkan-sen and the Kijun-sen are both showing a horizontal trend.
If the bears stay in control, the price will drop towards 0.7750 otherwise it will grow to 0.78970.
https://fxglory.com/audusd-analysis-for-11-08-2017/


Thursday, August 10, 2017
USDJPY analysis for 10.08.2017
Japan is releasing Tertiary Industry Activity m/m, PPI y/y, and Core Machinery Orders m/m data along with the US publishing Federal Budget Balance, Natural Gas Storage, Core PPI m/m and Unemployment Claims.
The support rests at 109.780 with resistance at 110.260 which both lines are below the weekly pivot point at 110.520. The EMA of 10 is moving with bearish bias along the descendant channel and it is below the EMA of 100 and the EMA of 200. The RSI is falling towards the oversold area, the Stochastic is showing downward momentum and the MACD indicator is in negative territory. The ADX is not showing any clear signals.
Sellers can target 109 level.
https://fxglory.com/usdjpy-analysis-for-10-08-2017/


NZDUSD analysis for 10.08.2017
New Zealand has published Interest Rate Decision and the US is releasing Initial Jobless Claims and Core PPI MoM.
The support rests at 0.72280 with resistance at 0.73020 which both lines are below the weekly pivot point at 0.74420. The EMA of 10 is moving with bearish bias along the descendant channel and it is below the EMA of 100 and 200. The RSI is moving in oversold area, the MACD indicator is in negative territory and the Stochastic is showing downward momentum. The ADX is not showing any clear signals. The price is below the Ichimoku Cloud and the Chinkou Span. The Tenkan-sen and the Kijun-sen are both showing a downward trend.
The pair may go down a little bit but the support area seems to be too strong to be broken therefore buyers can target 0.7389.
https://fxglory.com/nzdusd-analysis-for-10-08-2017/


EURUSD analysis for 10.08.2017
USD based pairs are chiefly under the influence of the US and North Korea issue. Now that there are no reports in Eurozone, traders are waiting for the US PPI data.
The support rests at 1.17120 with resistance at 1.17740 which both lines are below the weekly pivot point at 1.18010. The EMA of 10 is moving with bearish bias along the descendant channel but it is above the EMA of 200 and the EMA of 100. The RSI is falling below the 50 level, the Stochastic is showing downward momentum and the MACD indicator is in negative territory. The ADX is showing sell signals.
EURUSD will continue its bearish trend towards 1.16.
https://fxglory.com/eurusd-analysis-for-10-08-2017/


Wednesday, August 9, 2017
NZDUSD analysis for 09.08.2017
There are no major economic reports in New Zealand however the US is publishing Wholesale Inventories MoM and Nonfarm Productivity QoQ Prel.
The support rests in 0.73020 with resistance at 0.73280 which both lines are below the weekly pivot point at 0.74420. The EMA of 10 is moving with bearish bias along the descendant channel and it is below the EMA of 200 and the EMA of 100. The RSI is moving in oversold area, the MACD indicator is in negative territory and the Stochastic is moving in low ranges. The ADX is showing buy signals. The price is below the Ichimoku Cloud and above the Chinkou Span. The Tenkan-sen is showing a downward trend while the Kijun-sen is showing a horizontal trend.
NZDUSD will continue its bearish trend towards 0.72.
https://fxglory.com/nzdusd-analysis-for-09-08-2017/


GBPUSD analysis for 09.08.2017
While GBP is under pressure because of the Brexit issue, USD is being supported by the JOLT employment data.
The support rests at 1.29660 with resistance at 1.30000 which both lines are below the weekly pivot point at 1.31080. The EMA of 10 is moving with bearish bias along the descendant channel and it has reached the EMA of 200 but both are below the EMA of 100. The RSI is moving horizontally in oversold area, the Stochastic is moving in low ranges and the MACD indicator is in negative territory. The ADX is showing weak buy signals.
Short positions are recommended targeting 1.2850.
https://fxglory.com/gbpusd-analysis-for-09-08-2017/


EURUSD analysis for 09.08.2017
USD has been supported by JOLT employment data.
The support rests at 1.17040 with resistance at 1.17660 which both lines are below the weekly pivot point at 1.18010. The EMA of 10 is moving with bearish bias along the descendant channel but it is above the EMA of 200 and the EMA of 100. The RSI is moving in oversold area, the Stochastic is showing downward momentum and the MACD indicator is in negative territory. The ADX is not showing any clear signals.
The resistance level breakout will push the pair upward towards 1.18 area otherwise it will drop to 1.169
https://fxglory.com/eurusd-analysis-for-09-08-2017/


Monday, August 7, 2017
USDCAD analysis for 07.08.2017
USD has been supported by the NFP and the wages data.
The pair is finding support at 1.26240 with resistance at 1.26910 which both lines are above the weekly pivot point at 1.25790. The EMA of 10 is moving with bullish bias along the ascendant channel and it is located below the EMA of 200 and above the EMA of 100. The RSI is moving horizontally in the overbought area, the MACD indicator is in positive territory and the Stochastic is moving in high ranges. The ADX is showing buy signals. The price is above the Ichimoku Cloud and the Chinkou Span. The Tenkan-sen and the Kijun-sen are both showing a horizontal trend.
Long positions are recommended targeting 1.27.
https://fxglory.com/usdcad-analysis-for-07-08-2017/


GBPUSD analysis for 07.08.2017
There are no major economic reports to influence GBPUSD however, USD has been supported by NFP results which came better than expected.
The support rests at 1.30370 with resistance at 1.30670 which both lines are below the weekly pivot point at 1.31080. The EMA of 10 is moving with bearish bias along the descendant channel but it is above the EMA of 200 and the EMA of 100. The RSI is moving horizontally in oversold area, the Stochastic is moving in low ranges and MACD indicator is in negative territory. The ADX is not showing any clear signals.
Buyers can wait for the resistance level breakout and then target 1.311.
https://fxglory.com/gbpusd-analysis-for-07-08-2017/


EURUSD analysis for 07.08.2017
Finally, EURUSD bullish trend has been broken by the positive reports from the US.
The support rests at 1.17690 with resistance at 1.18200 which the weekly pivot point at 1.18010 is located in between the lines. The EMA of 10 is moving with bearish bias but it is above the EMA of 200 and the EMA of 100. The RSI is moving horizontally on the 50 level, the Stochastic is showing upward momentum and the MACD indicator is in neutral territory. The ADX is not showing any clear signals.
EURUSD will continue its bullish trend to cover the recent loss towards 1.1880.
https://fxglory.com/eurusd-analysis-for-07-08-2017/


Friday, August 4, 2017
USDJPY analysis for 04.08.2017
With the lower chances of a Fed rate hike, USDJPY remains under pressure.
The support rests at 109.920 with resistance at 110.260 which both lines are below the weekly pivot point at 111.130. The EMA of 10 is moving with bearish bias along the descendant channel and it is below the EMA of 100 and the EMA of 200. The RSI is moving horizontally below the 50 level, the Stochastic is moving in low ranges and the MACD indicator is in negative territory. The ADX is not showing any clear signals.
The resistance level breakout can signal a correction pattern towards 111.5 otherwise, USDJPY will continue its bearish trend.
https://fxglory.com/usdjpy-analysis-for-04-08-2017/


Gold analysis for 04.08.2017
Gold has been supported due to Fed’s rate hikes issue and it will be under the influence of U.S. Non-Farm Payrolls report.
The support rests at 1266.91 with resistance at 1270.56 which both lines are above the weekly pivot point at 1260.53. The EMA of 10 is moving with bullish bias along the ascendant channel and it is above the EMA of 200 and the EMA of 100. The RSI is moving horizontally above the 50 level, the Stochastic is moving in high ranges and the MACD indicator is in positive territory. The ADX is not showing any clear signals. The price is above the Ichimoku Cloud and the Chinkou Span. The Tenkan-sen and the Kijun-sen are both showing a horizontal trend.
Gold will continue its bullish trend towards 1275.
https://fxglory.com/gold-analysis-for-04-08-2017/


EURUSD analysis for 04.08.2017
While there were no major economic reports in Eurozone, USD could not cover its loss and today the US is publishing Non-Farm Payrolls, Unemployment Rate and Balance of Trade.
The support rests at 1.18610 with resistance at 1.18970 which both lines are above the weekly pivot point at 1.17110. The EMA of 10 is moving with bullish bias along the ascendant channel and it is above the EMA of 200 and the EMA of 100. The RSI is moving horizontally in the overbought area, the Stochastic is showing upward momentum and the MACD indicator is in positive territory. The ADX is showing buy signals.
Long positions are recommended targeting 1.20.
https://fxglory.com/eurusd-analysis-for-04-08-2017/


Thursday, August 3, 2017
NZDUSD analysis for 03.08.2017
There are no major economic reports in New Zealand, however, the US is publishing ISM Non-Manufacturing PMI and Unemployment Claims.
The support rests at 0.73830 with resistance at 0.74090 which both lines are below the weekly pivot point at 0.74900. The EMA of 10 is moving with bearish bias along the descendant channel but it is above the EMA of 100 and 200. The RSI is moving in oversold area, the MACD indicator is in negative territory and the Stochastic is showing downward momentum. The ADX is showing sell signals. The price is below the Ichimoku Cloud and the Chinkou Span. The Tenkan-sen is showing a downward trend while the Kijun-sen is showing a horizontal trend.
The support level breakthrough will drag the price to lower levels otherwise the pair will start its correction pattern towards 0.7550.
https://fxglory.com/nzdusd-analysis-for-03-08-2017/


GBPUSD analysis for 03.08.2017
UK inflation hearings, BOE rate announcement and statement along with BOE Governor Carney’s speech will have a great impact on GBPUSD.
The support rests at 1.32120 with resistance at 1.32440 which both lines are above the weekly pivot point at 1.30920. The EMA of 10 is moving with bullish bias along the ascendant channel and it is above the EMA of 200 and the EMA of 100. The RSI is moving horizontally below the overbought area, the Stochastic is showing downward momentum and MACD indicator is in positive territory. The ADX is not showing any clear signals.
Long positions are recommended targeting 1.3450.
https://fxglory.com/gbpusd-analysis-for-03-08-2017/


EURUSD analysis for 03.08.2017
USD was weakened again due to ADP employment report and today there are no important economic reports to influence EURUSD.
The support rests at 1.18270 with resistance at 1.18670 which both lines are above the weekly pivot point at 1.17110. The EMA of 10 is moving with bullish bias along the ascendant channel and it is above the EMA of 200 and the EMA of 100. The RSI is moving horizontally below the overbought area, the Stochastic is showing downward momentum and the MACD indicator is in positive territory. The ADX is showing buy signals.
Pullbacks cannot be considered as a start of the correction pattern. The pair will be choppy between 1.82 and 1.9 area.
https://fxglory.com/eurusd-analysis-for-03-08-2017/


Wednesday, August 2, 2017
USDJPY analysis for 02.08.2017
Japan is releasing the Consumer Confidence and Monetary Base y/y data along with the US publishing Crude Oil Inventories and ADP Non-Farm Employment Change.
The support rests at 110.160 with resistance at 110.960 which both lines are below the weekly pivot point at 111.130. The EMA of 10 is moving with bearish bias along the descendant channel and it is below the EMA of 100 and the EMA of 200. The RSI is rising towards the 50 level, the Stochastic is moving in high ranges and the MACD indicator is in negative territory. The ADX is showing buy signals.
USDJPY will continue its bearish trend towards 109 area.
https://fxglory.com/usdjpy-analysis-for-02-08-2017/


EURUSD analysis for 02.08.2017
It seems that USD becoming weak has been a policy of the Trump government. EUR is appearing strong due to PMI data from Germany.
The support rests at 1.17800 with resistance at 1.18500 which both lines are above the weekly pivot point at 1.17110. The EMA of 10 is moving with bullish bias along the ascendant channel and it is above the EMA of 200 and the EMA of 100. The RSI is moving horizontally in overbought area, the Stochastic is showing upward momentum and the MACD indicator is in positive territory. The ADX is not showing any clear signals.
Long positions are recommended targeting 1.19.
https://fxglory.com/eurusd-analysis-for-02-08-2017/


AUDUSD analysis for 02.08.2017
AUDUSD is under the influence of some economic reports such as the Reserve Bank of Australia’s interest rate statement and Building Permits MoM in Australia and ADP Employment Change in the US.
The support rests at 0.79270 with resistance at 0.79810 which both lines are above the monthly pivot point at 0.78800. The EMA of 10 is moving horizontally in the ascendant channel and it is above the EMA of 100 and the EMA of 200. The RSI is moving on the 50 level, the MACD indicator is in neutral territory and the Stochastic is moving in low ranges. The ADX is not showing any clear signals. The price is in the Ichimoku Cloud and above the Chinkou Span. The Tenkan-sen and the Kijun-sen are both showing a horizontal trend.
It is difficult to see the trend direction therefore if the support level is broken, the pair will drop to 0.7900 otherwise it will rise towards 0.90.
https://fxglory.com/audusd-analysis-for-02-08-2017/


Subscribe to:
Posts (Atom)